
Introduction
Today I will talk about an interesting use case for Citrix Netscaler monitoring with the Squared Up Web API tile. Keep in mind that this is only used for visualization purposes, as the Web API tile will not alert on anything. I am using the Web API tile to supplement the Netscaler management pack with additional data.
Integrating an API in a management pack is something I’ll talk about in a future blogpost.
The example I’m showing today is fairly straight forward, I had a few Citrix Netscaler counters missing in SCOM, which are available through the Netscaler API.
I wanted to be able to see the Current connections and data throughput of each Load balanced service. As Netscaler licensing is based on throughput, it is interesting to know which load balanced service is consuming most bandwidth.
Keep in mind that you’ll need the Citrix Netscaler Management Pack (which was previously owned by Comtrade.) if you want a virtual server specific statistic perspective. But, depending on how you set it up, this is not a requirement.
I have tested and implemented this with Netscaler v11.0 and up.
Configuration
To get API data in Squared Up, the first thing you’ll have to do is create a read-only user in Netscaler. I’m not going to cover this as this process is fairly straight forward.
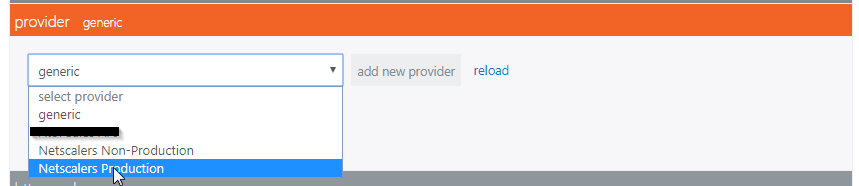
Once the user is created, we can create a new Web API Provider in Squared Up.
Creating the provider
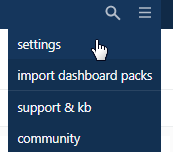
Go to Settings
Select Web API

Click Add new provider (this can be done for each netscaler environment you have)

Fill in the Service Name to your liking.
Base URL is:
https://<yournetscaleraddress>/nitro/v1/
Ignore valid SSL: ON,unless you do have a valid certificate for this :).
Add the following default headers:
x-nitro-user – <username that you created earlier>
x-nitro-pass – <password that you created earlier>
content-type application/vnd.com.citrix.netscaler.login+json
Finally click Add Provider

Visualizing the Netscaler API Data
Once the provider is added, let’s create a dashboard! Click the plus sign on top.

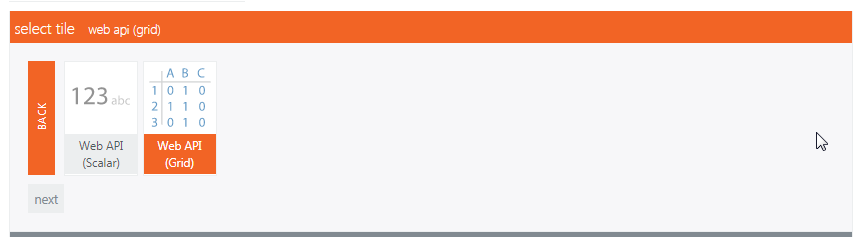
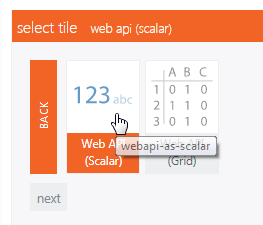
Select Web API tile. We’ll use the grid as an example.
Select the provider we created earlier
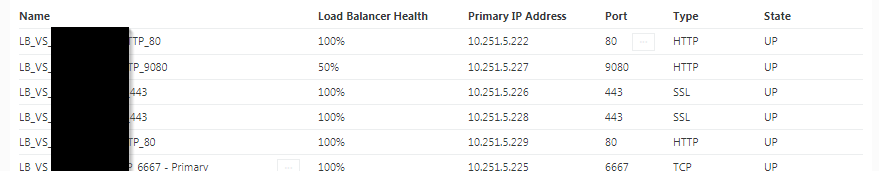
In this case, I want statistics of all my virtual servers created on the netscaler. The API documentation says you can do this by adding /stat/lbvserver.
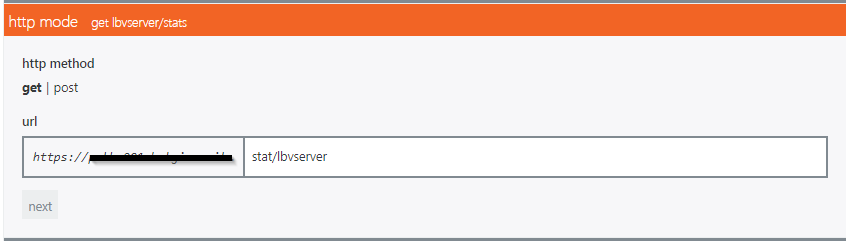
Leave headers and data empty.
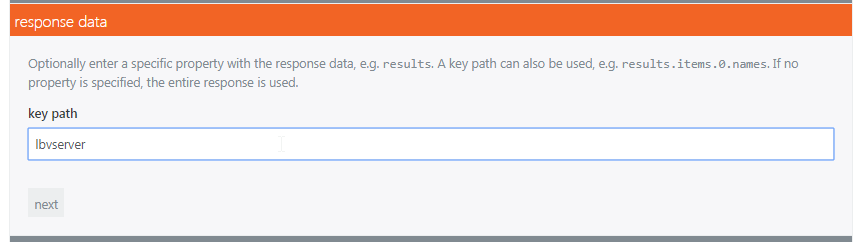
In reponse data, fill in lbvserver as key path. The API returns JSON data in this case, and the values we need are contained in lbvserver. If you want to show statistics of other types of objects, an overview can be found here.
Once this key is filled in it should show all the data available.
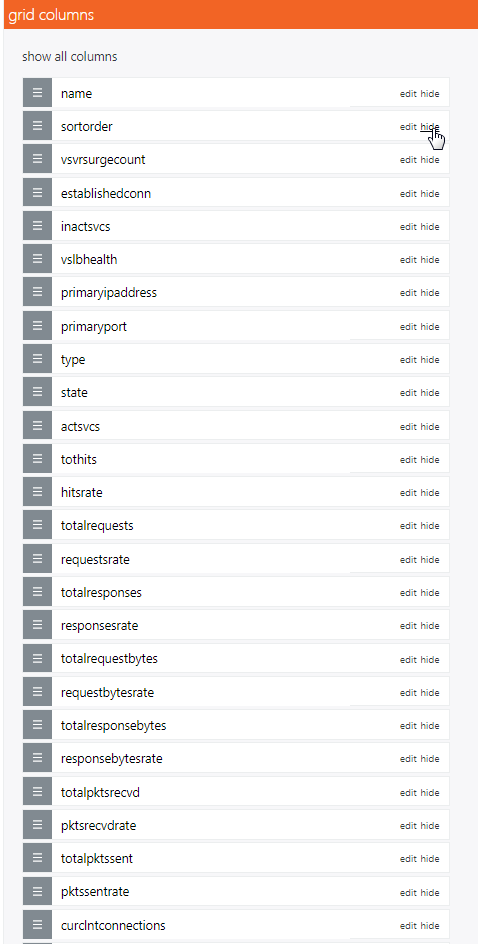
In Grid Colums we can choose to hide certain columns and rename the column titles if required.
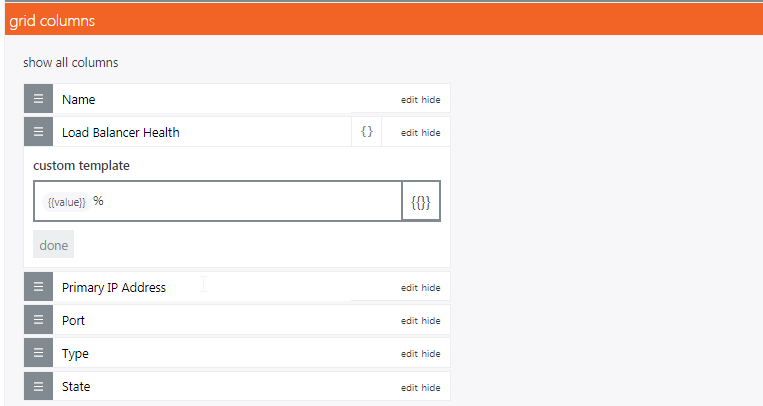
After fiddling with the columns and giving the column headers a more friendly name, it looks like this:
Another way to show data is the scalar view of the Web API tile.
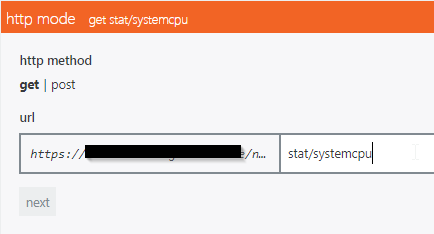
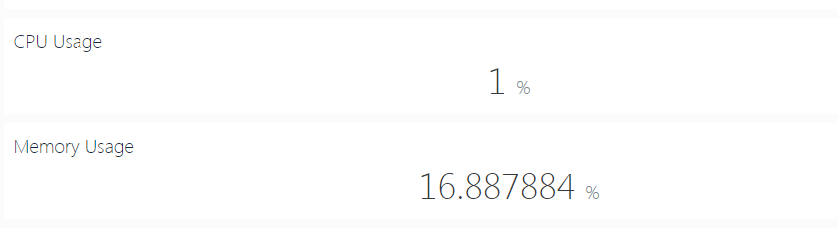
Let’s add CPU Usage:
Select the same provider as we did before.
This time we fill in stat/systemcpu
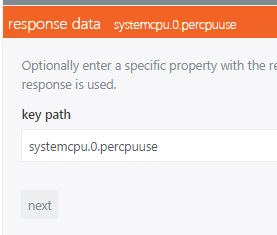
Go to Response Data, fill in systemcpu.0.percpuuse, this reflects the first value that is returned of percpuuse.
Select the Font Size and Unit (in this case %)
End result looks like this:
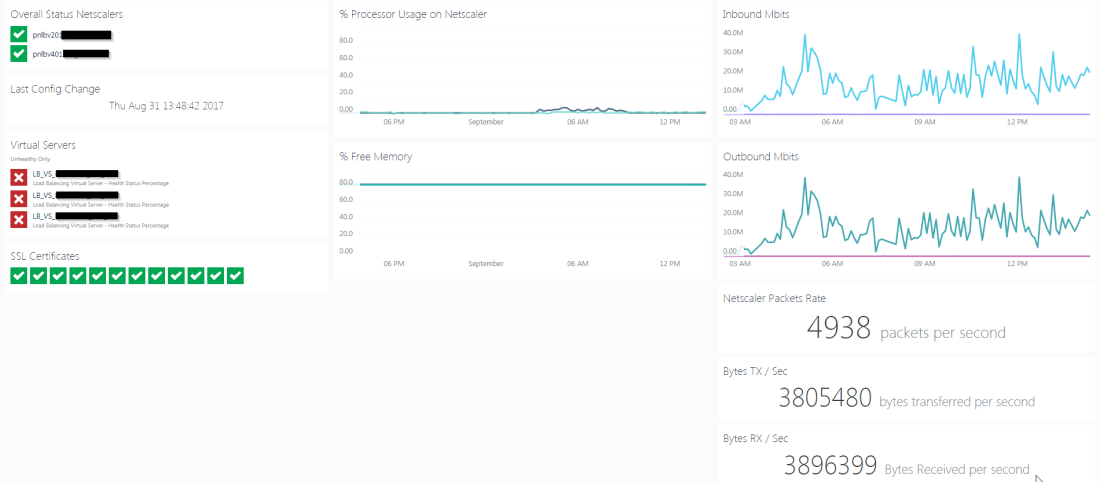
The last thing I want to cover is creating a perspective for each load balanced virtual server in Squared Up. This does require the Comtrade Citrix Netscaler MP!
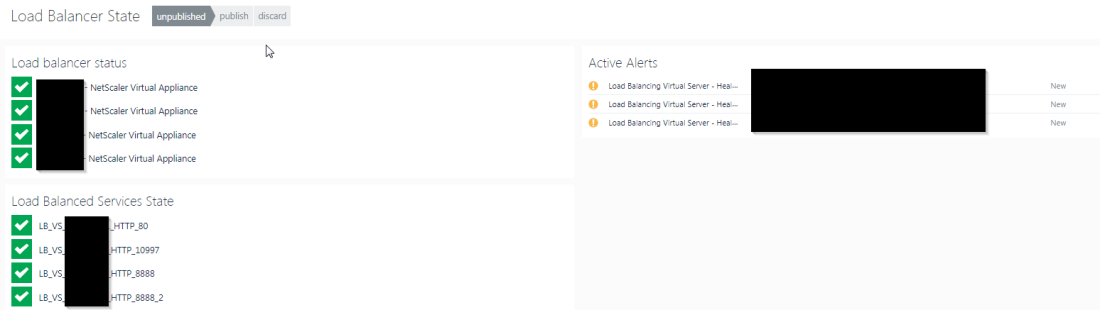
Create a dashboard containing your Load Balancers. Create a column by clicking
Add a new status tile. Choose advanced scope -> Citrix Netscaler Appliance.
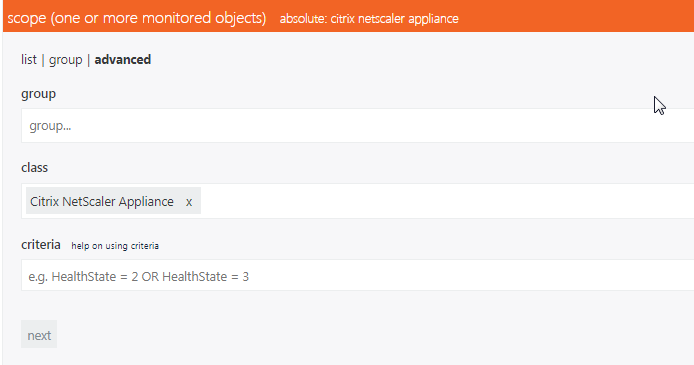
Which should result in listing all your monitored Netscaler appliances.

Add another State Tile with this scope:

In the right hand column we’ll add an Alert tile using the same advanced scope.
This should result in a very simple dashboard:
Configuring the perspective
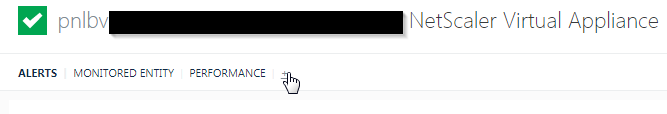
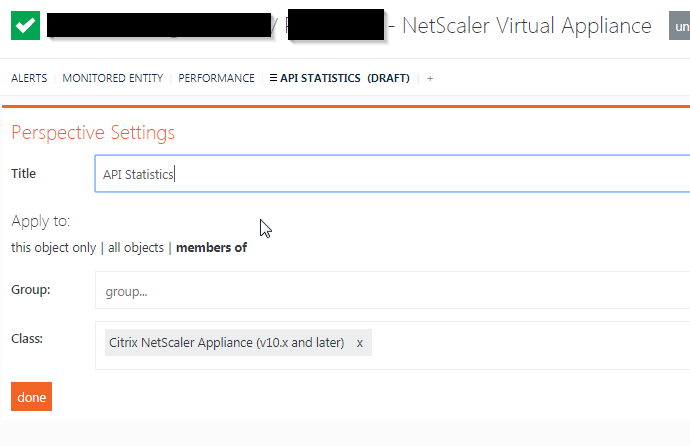
Click on the state of one of the Load Balanced Virtual Servers and we’ll create a perspective by clicking the + Sign
I’ll call the perspective ‘API Statistics’.
The rest can remain default. Click Done
First create two columns in the perspective. I’ll walk you through creating this perspective:
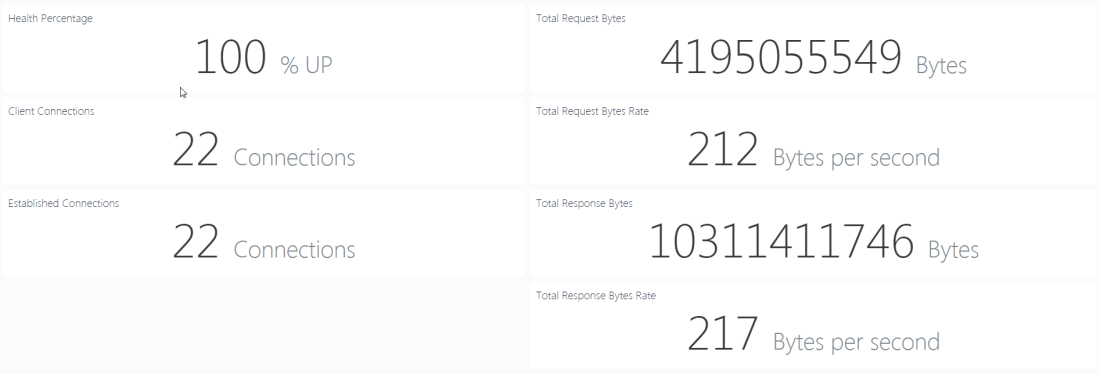
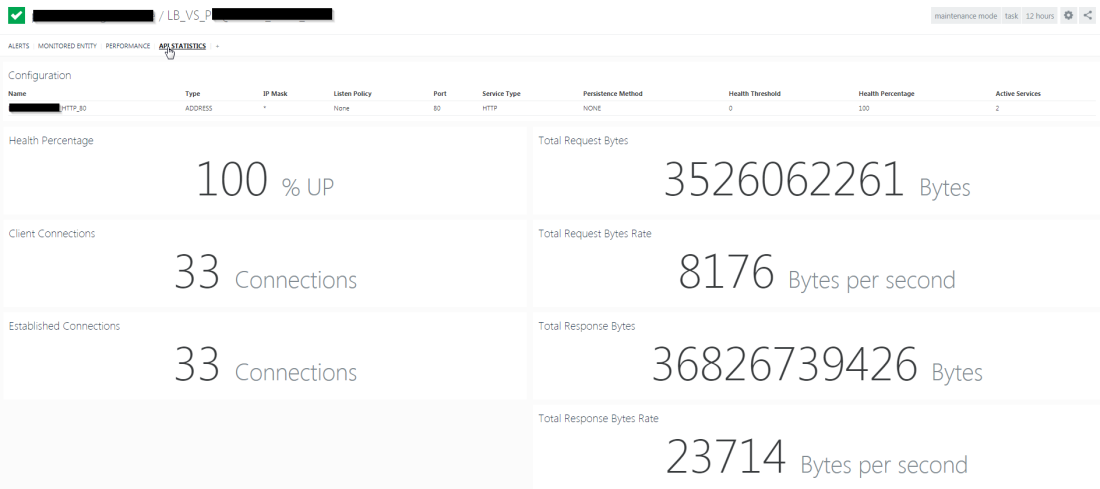
To achieve this result, we’ll create 7 Web API (Scalar) tiles. Below is the configuration required to get the data.
Health Percentage.
HTTP mode: GET
URL: stat/lbvserver/{{displayName}}
Response Data: lbvserver.0.vslbhealth
Client Connections
HTTP mode: GET
URL: stat/lbvserver/{{displayName}}
Response Data: lbvserver.0.curclntconnections
Established Connections
HTTP mode: GET
URL: stat/lbvserver/{{displayName}}
Response Data: lbvserver.0.establishedconn
Total Request Bytes
HTTP mode: GET
URL: stat/lbvserver/{{displayName}}
Response Data: lbvserver.0.totalrequestbytes
Total Request Bytes Rate
HTTP mode: GET
URL: stat/lbvserver/{{displayName}}
Response Data: lbvserver.0.requestbytesrate
Total Response Bytes
HTTP mode: GET
URL: stat/lbvserver/{{displayName}}
Response Data: lbvserver.0.totalresponsebytes
Total Response Bytes Rate
HTTP mode: GET
URL: stat/lbvserver/{{displayName}}
Response Data: lbvserver.0.responsebytesrate
Once configured and published, you should see this data for each virtual server.
The {{displayName}} value will make sure that the statistics are changed based on the virtual server you drill down into. The ‘0’ in the response data represents the first value of the API response.
Summary
Hopefully that gives you an idea of the usefulness of the Web API tile. Remember you can combine SCOM data and Web API data as well, like this:
Obviously this is merely scratching the surface of what is possible with the Netscaler API, just thought I’d share my insights with a few possibilities.
The clear text password in the API configuration itself I am not very happy with, so if you have any suggestions to improve on this, feel free to comment below!
Br,
Jasper

full disclosure: work at Squared Up
—
Until we allow custom token-based authentication (not on a roadmap at the moment) – you’ll have to use this form of authentication.
The redeeming qualities of this are:
– All Web API providers are stored securely
– The default headers can only be seen by SCOM admins, or people with the edit-webapi-providers permission
– Users can make tiles for Web APIs with the “construct-sensitive-queries” permission, but will never see (or receive) the password
Hopefully this sets your mind at ease for now. Really love what you’ve done with the tile, just goes to show that there are near limitless possibilities when combining data from external sources with your SCOM data. 🙂
LikeLike
Jasper, this is awesome!! Thank you. One question though so far… how did you get memory usage? When I give CPU it just gives me 1 value.
Also, do you know if there’s a way to tap into Management and Analytics (MAS)?
LikeLike
Hey Gary, are you sure the CPU utilization isn’t just low? 🙂
I haven’t heard about Management and Analytics on Citrix netscaler unfortunately.
LikeLike
haha. It may be. 1% cpu most of the time. We have about 3000 connections through our NS for Exchange and a fraction for Gateway connections. MAS is apparently their new management tool. https://www.citrix.com/products/netscaler-management-and-analytics-system/
Are you aware of any other tools that we can utilize this web api feature? I have Cisco UCS, Cisco TMS, Orion, Palo Alto, JAMF (apple management) and some more here. I think this is pretty slick.
LikeLike
Hey Gary,
You could cross check it with the Netscaler interface itself if you want to be 100% certain regarding the CPU usage.
There are certain limitations to authorization mechanisms for the web api as Sam Lord’s comment above you has pointed out. Your REST api will also have to return JSON code I believe.
JAMF has a Rest API as well, I believe Martin Erhnst (adatum.no) has done an integration with an Apple device management tool as well. You could ask him.
That said, there are other ways of integrating API’s into SCOM, which is writing a management pack that triggers powershell scripts to retrieve that data, but it is a bit more advanced. I’m actually looking into creating an MP based on the Netscaler API.
For Palo Alto I do have an MP which I made for a specific customer, which only supports one model, but can always be extended.
If you need some consultancy on any of these topics, you’re always free to contact me as well. 😉
LikeLike
Great post, thank you 🙂
Do you know if I can apply some conditional formatting (e.g. colors) within the WebAPI title?
LikeLike