
Hello Everyone,
Today I want to talk about a little management pack I made together with the help of Martin Erhnst, who helped redesign the MP to work with the new API.
Uptimerobot is a website that allows you to create up to 50 web checks for free. This includes TCP, Ping, HTTP checks. It literally takes 5 minutes to create a few checks. There is also a paid plan if you want to create more web checks and unlock more features.
What makes UptimeRobot great is that it has an easy to use API that exposes all your webcheck data. This allows us to query that data through powershell, and integrate it into a management pack.
Let’s go through what you need to do to set up the management pack.
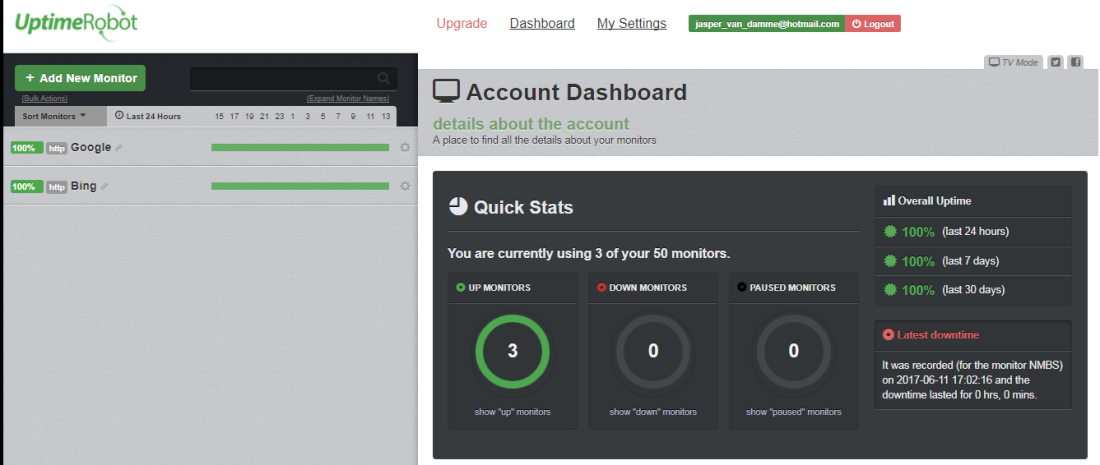
First, you need to create an account on UptimeRobot.
Once logged in, you can start creating webchecks! Click the add New Monitor button.
Choose the type and fill in the blanks.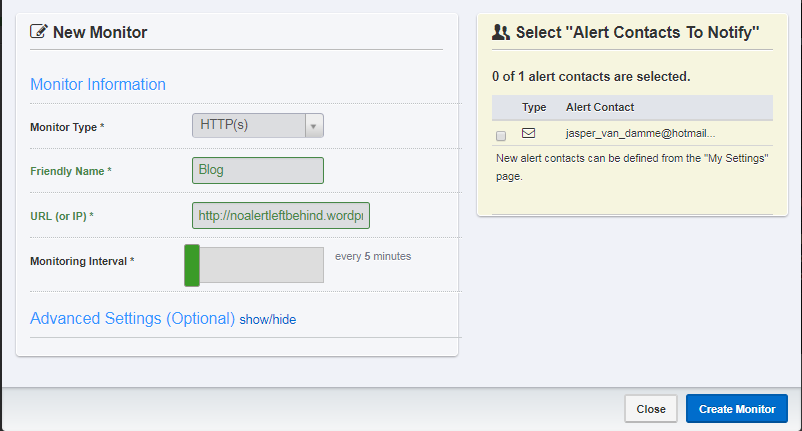
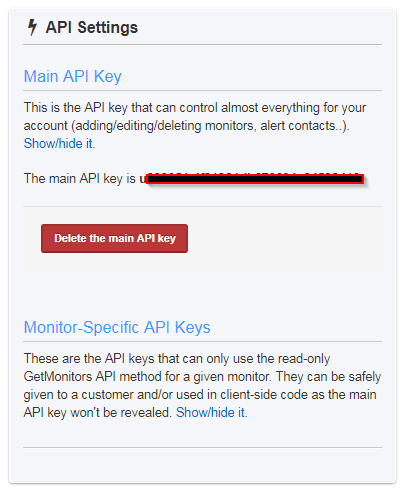
Once your webchecks are created, we’ll need the APIkey to get the data from the API. You can find this under My settings on the right bottom side of the page.
Next up we need to designate one or more servers that have access to the internet that will be polling the information from the API. These will be our web check watcher nodes.
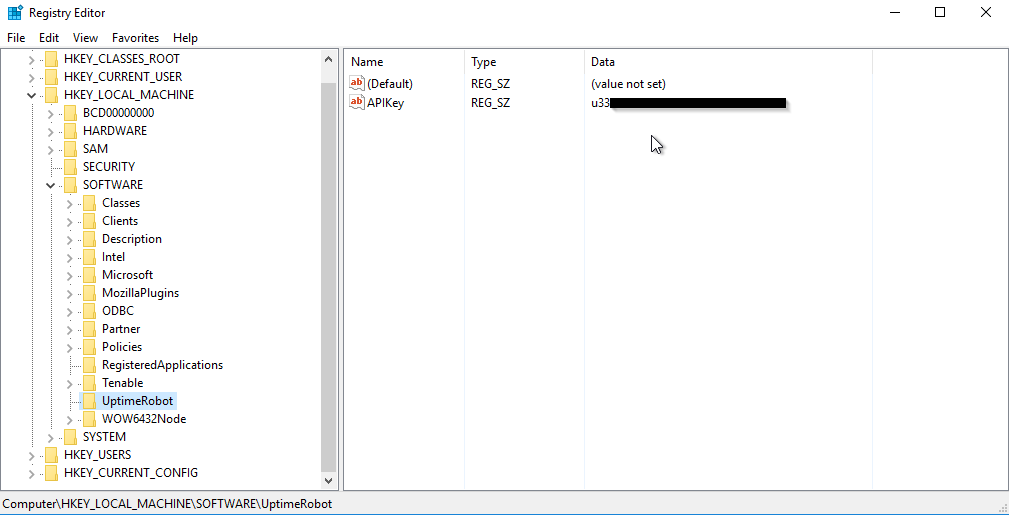
To designate a server you need to create a registry key with a string value to trigger the discovery in SCOM. (Should create a task for this later)
Create a key UptimeRobot under HKLM\Software, in the key create a value APIkey, containing the APIkey from the web page.
A potential improvement, as Martin pointed out, would be to put this into a run as account.
Next you’ll need to define an AD account that has permissions to access the internet and create it in SCOM.
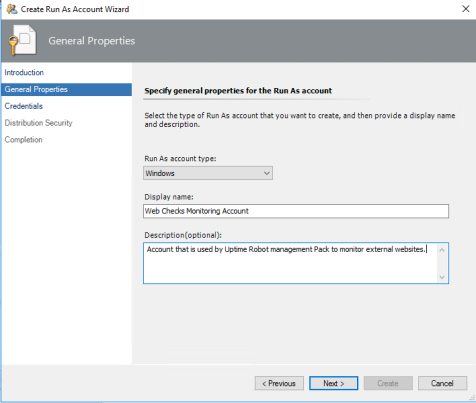
Once that’s created go to Administration -> Create Run As Account.

Select Windows and give the account a name.
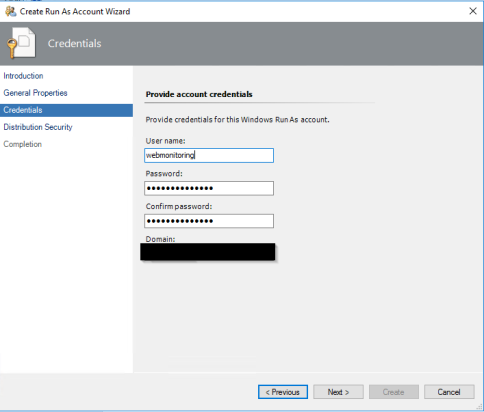
Fill in the credentials
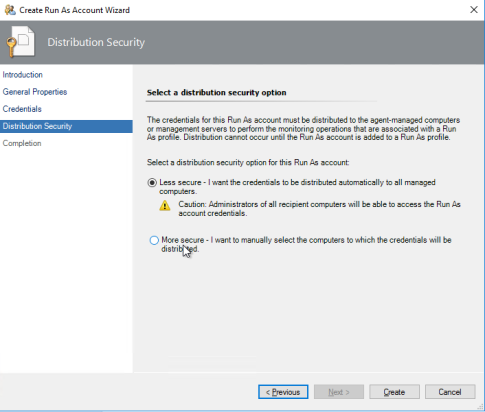
Choose Less Secure and click Create
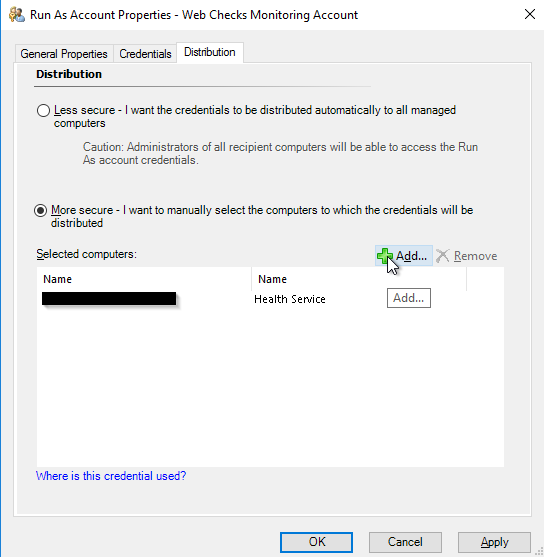
Once created, you can distribute the account to the watcher nodes that will execute the web checks.
Right click the account you created and select the Distribution tab.
Next up, we’ll add the account to the Run as Profile, Go to Administration -> Profiles
Choose the Web Checks Monitoring Account we created and click Save

That’s it! Once the discoveries are done, the web checks will show up in SCOM.
The management pack contains 2 monitors and 1 rule. 1 Monitor which will poll the status from the API, another one will check the average response time over a default sample rate of 3 . The performance rule polls the response time of the web check.
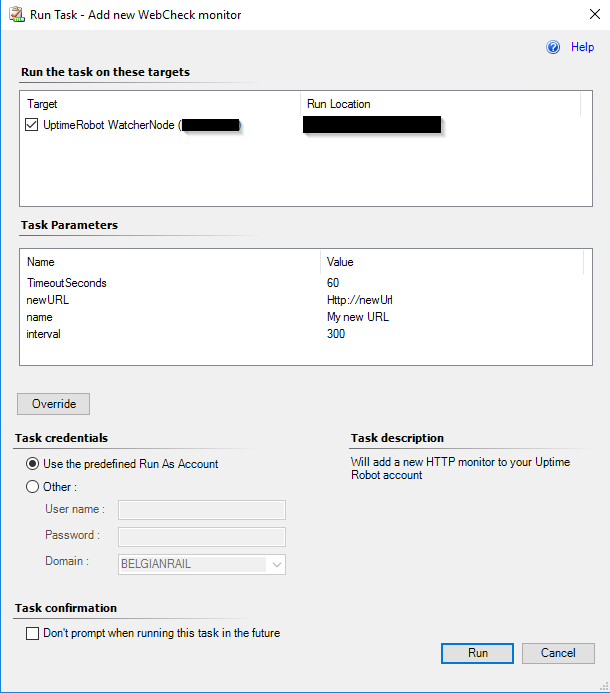
Martin also created a task that will allow you to create web checks from the console, neat right?
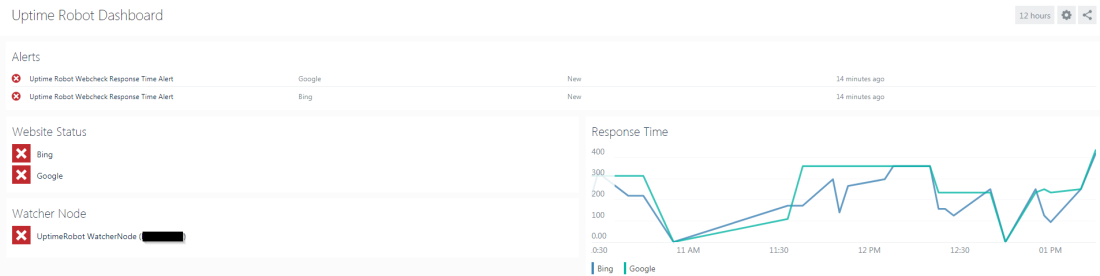
Views are created under the UptimeRobot folder, or if you’re like me and prefer to create a Squared Up dashboard, that’s up to you.
You can download the MP and VS Solution here:
Jasper

Great!!!!!
LikeLike
HI Jasper,
Thanks for this very handy info and MP.
I have tried this out but have ran into a problem.
My WatcherNode is showing as Not Monitored. I have tried a few different Nodes but its still the same.
Any ideas?
Regarding the AD account – you have created the account called “Webmonitoring”, is this the AD account that has access to the internet?
Does this account also need to have a User role setup in SCOM?
Regards
Saiyad
LikeLike
Hey Saiyad,
As long as you don’t use a proxy to connect to the internet, you do not need to configure an account. Otherwise you do need one account that has access to the internet which you have to add in SCOM and add to the profile.
Regarding the watcher node, there is no health rollup from the web checks to the watcher node. This is to prevent that the server will become critical when a webcheck fails. So it is unmonitored because there are no monitors associated with it. There are monitors associated with the webchecks.
Br,
Jasper
LikeLike
Thanks Jasper, that makes sense.
Since I have set this up, I do not see anything in Web alert view and State View.
How do I know or where do I go and see if this setup is pulling data from Uptime Robot on my particular site?
Also do you have any instructions on how you set this up in Squared Up or point me to a KB I can use to set this and any other URL monitoring using SquaredUp dashboard.
I am trialling out v3 at the moment.
Regards
SR
LikeLike
Hey Saiyad,
If you go into the Eventviewer of the watcher node, under Operations Manager, there should be event id’s 8001-8002-8003 which shows if there were any web checks found.
Other than that they should show up under the web checks state view. Keep in mind that the discovery only runs every hour.
Regarding squared up resources. I’ll see if I can export my dashboard and share it, but do not have access right now. Will keep you posted.
BR,
Jasper
LikeLike
Hi Jasper,
I can see 8001 and 8002: WebChecksDiscovery.ps1 : Discovery Started.
But I could not find 8003.
Still the Web check state view is empty.
LikeLike
Hey Saiyad, if you don’t see any 8003 events and you have configured your API key properly, I would think this is related to your internet connection. I have it running here properly. Are you using any proxy?
LikeLike
Yes I am but the account that i am using has access to the internet as it has been tested.
I did a Discovered Inventory where I changed Target to “UptimeRobot Web Check” and there are no objects showing up. What does this mean and what should I do? Its been about 4 days since I installed the MP. Should I remove and re do the whole thing again?
LikeLike
Hey Saiyad,
Could you tell me if you are using a proxy or not? Have you distributed the credentials in SCOM to the Watcher Node? Otherwise it will keep using the local system account.
If you are using a proxy, I would also recommend running ‘netsh winhttp set proxy import ie’ in a command prompt to force every user to use the proxy.
Br,
Jasper
LikeLike
Done that. Still no change.
LikeLike
Alright. Can you try to run the following part of the powershell script of the discovery manually with that specific user to see if it works? Check if $webmonitors contains any output. That should contain your webchecks.
$APIKey =
$Header = @{
“Content-Type” = “application/x-www-form-urlencoded”
“Cache-Control” = “no-cache”
}
$body = @{
“api_key” = $APIKey
“time_zone” = “1”
“format” = “json”
}
$URL = ‘https://api.uptimerobot.com/v2/getMonitors’
$WebMonitors = (Invoke-RestMethod -Method POST -uri $URL -Headers $header -Body $body).Monitors
LikeLike
Forgot to mention, in the above code snippet, please fill in your APIkey.
LikeLike
Hi JVD,
Seems like the last few of my replies didn’t make it through.
Long story short, Yes – i think my issue was proxy.
Initially when i ran your script, i got = Invoke-RestMethod : The remote server returned an error: (407) Proxy Authentication Required.
I passed credentials in the PS script and it retrieved the web checks.
I moved my Watcher Node to a server in the DMZ.
Got my Event ID 8003 (finally).
Now I am getting my Websites Web check in State View but it is Red in critical .
Health Explorer:
Webcheck Response Time Monitor – 1- http://www.blah.blah (UptimeRobotWebCheck)
Value is 688
But there is nothing in the Web Checks Alert View
Did I miss something?
SR
LikeLike
No, happy you figured out the problem :).
Could you try downloading the latest release from github? I have tried to reproduce your issue and for me it seems to be working fine.
https://github.com/jaspervd86/Uptime-Robot-MP/blob/master/UptimeRobot.ManagementPack.mp
Br,
Jasper
LikeLike
Ok – Got alert in Alert View.
but next question is, this is telling me that site is responding slow but in UptimeRobot the site is only peaked at 1328ms (1.3sec). If this API is reading data from Uptime Robot than i was expecting the same reading or is the alert show the time it took to get data from Uptime Robot?
LikeLike
Hey Saiyad,
The default treshold is 500 ms, which might be a bit low. You can change that treshold through an override.
Br,
Jasper
LikeLike
Hello here,
Same issue.. no event 8003 and no elements in the State View.
I tried to run the task “Add new Webcheck monitor”, the task is successful but nothing happened.
Any help ?
LikeLike
Hey Mona,
If you add a web check through the website itself, do those show up? Are you using a proxy to connect to the internet?
Br,
Jasper
LikeLike
Hello Jesper,
Thanks for your reply !
Finnaly it works ! But during 25 minutes only..
Yes, I use the proxy to connect at Internet. But we cannot configure any proxy, the connection is direct. So we did an exception to allow this.
After this, I got all monitors in the state view.. but.. after 25 minutes the Watcher Node State View State change to Critical and all monitors switch to Critical. I don’t understand why…
LikeLike
Hello Guys,
Finnaly it works ! But during 25 minutes only..
Yes, the problem was the FW. In fact, we cannot configure any proxy so the connection is direct. We did an exception to allow this.
So I got all monitors in the state view.. but.. after 25 minutes the Watcher Node State View State change to Critical and all monitors switch to Critical. I don’t understand why…
LikeLike
Can you please delete my last comment ?
It should be interesting to know all urls that must be allowed in the FW.
Do you know it ?
I’m available by email.
LikeLike
[PROBLEM SOLVED]
Hi Jespers,
Finallay everything works fine !! The threshold was too low that’s why I got alerts ahaha 🙂
So I did some override and now it’s perfect !
Thank you !!
LikeLike
Hi Jasper, i have this installed and working well for monitoring external sites, the only problem im having is when uptime robot cannot be contacted all the sites become unhealthy and alert, is there a way to change this so we get a single alert (maybe from the watcher node) when connection is lost and the actual check states would become unmonitored rather than unhealthy as that would better reflect what is actually going on
LikeLike
Hey Dave, good idea! I’ll implement this in the next release, will let you know once it’s updated.
LikeLike
Hi Jasper,
I have come across your MP and it sounds amazing. However I am having issues with the discovery.
I have tested this on 3 servers, using the Run As account and not depending on the location.
Enabled the API on Uptime Robot and added the keys as per the above. Once the servers get discovered I can see the event ids being produced 8001, 8002 & 8003 but nothing is being populated in state view.
The event id 8003 only has WebChecksDiscovery.ps1 : Added instance .friendly_name
I also tried the powershell script you mentioned in a previous comment and nothing is in the output.
Are you able to help please where I may have gone wrong?
LikeLike
Hi Peter, are you using a proxy server of any kind to access the internet by any chance? Keep in mind that you require a run as account with internet access as well should you use a proxy.
LikeLike
Hi Jasper, I tried it on one server without a proxy and another that uses a proxy server, making sure the account used in the Run As does have internet access. But nothing is still being shown in the State View. Also when the Event 8003 is logged, should it be listing all the web monitors listed in UptimeRobot? Or just the entry “Added instance .friendly_name”?
LikeLike
Hi. I have also strange kind of problem. Everything kinda works but randomly i am getting in scom status 0 (paused) for all sites i monitor. I have premium version of Uptime robot with 1 minute check, also i have made overrides in SCOM for all sites (check from 300seconds to 60 and treshold from 500ms to 10000ms. I would be perfectly satisfied without checking for Pause (status 0). Please help!
LikeLike
Hi Borut, Sorry for the late reply but If I understand correctly you want the test to be healthy when the status is 0?
Br,
Jasper
LikeLike
yes
LikeLike
I have fixed the management pack. You can download the new version from Github. It will no longer alert when it is in paused, only when the state is 8 or 9.
LikeLike
Hi Jasper,
I have added a few more URL’s to Uptime Robort and updated the API key in the registry.
I ran the PS script and am getting a blank response for the “Supply values for the following parameters:”
What am i missing here?
Regards
SR
LikeLike
Hi guys,
Hope this does not sound like a dumb question but how do i set up e-mail Notifications once the integration has been setup?
i know you can send e-mail alerts from Uptime Robot but the I find i have more control over the text in the alerts if i create it in SCOM.
Regards
SR
LikeLike
Hello guys,
It doesn’t work for me. I tried everything, let me show you :
1. Proxy used but everything has been opened (based on uptime robot support ip/hostname list)
2. The event 8003 is not present in my log
I tried to start this :
$APIKey = “MyAPI”
$Header = @{
“Content-Type” = “application/x-www-form-urlencoded”
“Cache-Control” = “no-cache”
}
$body = @{
“api_key” = $APIKey
“time_zone” = “1”
“format” = “json”
}
$URL = ‘https://api.uptimerobot.com/v2/getMonitors’
[Net.ServicePointManager]::SecurityProtocol = [Net.SecurityProtocolType]::Tls12
$WebMonitors = (Invoke-RestMethod -Method POST -uri $URL -Headers $header -Body $body).Monitor
My Error ==>
Invoke-RestMethod : The underlying connection was closed: An unexpected error occurred on a send.
At line:47 char:17
+ … Monitors = (Invoke-RestMethod -Method POST -uri $URL -Headers $header …
+ ~~~~~~~~~~~~~~~~~~~~~~~~~~~~~~~~~~~~~~~~~~~~~~~~~~~~~~~~~
+ CategoryInfo : InvalidOperation: (System.Net.HttpWebRequest:HttpWebRequest) [Invoke-RestMethod], WebException
+ FullyQualifiedErrorId : WebCmdletWebResponseException,Microsoft.PowerShell.Commands.InvokeRestMethodCommand
After some search, it seems that Powershell uses TLS1 and TLS12 it ineeded.
So let’s fix it withi the following command line :
[Net.ServicePointManager]::SecurityProtocol = [Net.SecurityProtocolType]::Tls12
Check to be sure that the edit has been set :
PS C:\Users\myUser> [Net.ServicePointManager]::SecurityProtocol
Tls12
But same error on the script :
Invoke-RestMethod : The underlying connection was closed: An unexpected error occurred on a send.
Any idea ?
Thank you very much
LikeLike
[EDIT]
I tried to execute the script from my laptop connected at free internet (without proxy)
PS C:\temp> .\test.ps1
Invoke-RestMethod : The remote server returned an error: (524) Origin Time-out.
At C:\temp\test.ps1:16 char:17
+ … Monitors = (Invoke-RestMethod -Method POST -uri $URL -Headers $header …
+ ~~~~~~~~~~~~~~~~~~~~~~~~~~~~~~~~~~~~~~~~~~~~~~~~~~~~~~~~~
+ CategoryInfo : InvalidOperation: (System.Net.HttpWebRequest:HttpWebRequest) [Invoke-RestMethod], WebException
+ FullyQualifiedErrorId : WebCmdletWebResponseException,Microsoft.PowerShell.Commands.InvokeRestMethodCommand
Error code => Invoke-RestMethod : The remote server returned an error: (524) Origin Time-out.
LikeLike
hmm very strange, can you try with my read-only API key to see if it is the same result?
ur333051-46e1bfeb7980fae2623c5e25
LikeLike
Mikael, I’m working on a new version with some improved logging. It should be on github later today.
LikeLike
It is on there now. I added the TLS 1.2 section as well. For me it works perfectly fine. Have you tried running the script without any proxy? For example on your mobile hotspot?
LikeLike
Hi,
Great work here. Could you confirm that the latest management pack only alerts on state 8 & 9 as im using the latest management pack from github and also experiencing alerts in a 0 / paused state.
Thanks in advance
LikeLike
To add looks like the sealed mp is 1.0.0.125 in the github repo, but the visual studio project is 1.0.2.0. Would you be able to update please.
LikeLike
Hey Simon, sorry for the late reply, but the management pack should only alert on 8 and 9. I have checked this in the visual studio solution. The latest version should also be on github now.
LikeLike
When I tried the Add new WebCheck monitor task using a test URL https://www.google.com to see if it will add, I got the following error. Please help. Thanks in advance.
Invoke-RestMethod : The request was aborted: Could not create SSL/TLS secure
channel.
At line:33 char:16
+ … wMonitor = (Invoke-RestMethod -Method POST -uri $URL -Headers $heade …
+ ~~~~~~~~~~~~~~~~~~~~~~~~~~~~~~~~~~~~~~~~~~~~~~~~~~~~~~~~~
+ CategoryInfo : InvalidOperation: (System.Net.HttpWebRequest:Htt
pWebRequest) [Invoke-RestMethod], WebException
+ FullyQualifiedErrorId : WebCmdletWebResponseException,Microsoft.PowerShe
ll.Commands.InvokeRestMethodCommand
Failed to create monitor for https://www.google.com
LikeLike
Hi Jasper,
I have installed the uptime robot to SCOM integration management pack in this blog and it was working great. Thanks for the wonderful tutorial. I noticed the number of URLs is limited to 50 and would like to know if you have any advise on how to increase that limit because we have hundreds of URLs in our uptime robot monitoring setup. The uptime robot api seemed to support setting for higher limit but there is no override in the management pack for setting that limit. The management pack is sealed and therefore I cannot export it and make changes in the xml. Any advise will be greatly appreciated. Thanks in advance.
Ron
LikeLike
Hi Ron, I have not tested it yet beyond just a few tests. Do you see any hard limit in the code? Either way I have uploaded the XML to github. You can find it here https://github.com/jaspervd86/Uptime-Robot-MP. Let me know if you find anything!
LikeLike
Hi Jasper,
Thank you for the reply and the xml files. Greatly appreciated. According to the Uptime Robot API document, the 50 urls limit is the default and max in the getMonitors method.
limit – optional (used for pagination. Defines the max number of records to return for the response. Default and max. is 50)
So if your api call did not explicitly specify the limit, it will be set to 50 by default. Since I have a few hundreds URLs monitored by Uptime Robot, I can only get the first 50 URLs sorted alphabetically. Downed URLs beyond the first 50 were missing. It will be great if we can override that pagination limit from the management pack or modify the management pack to support pagination if the Uptime Robot api only allow up to 50 URLs per page per api call. I have also messaged uptime robot support to see if the limit can be changed on my account settings side but I have not received any reply yet. Thanks in advanced.
Ron
LikeLike
Ok so if I understand correctly, the hard limit for the API is 50. So we would need to do several calls to the API for the discovery to be complete. Is my assumption correct?
LikeLike
Hi Jasper,
Yes. Your assumption is correct. I got a reply from Uptime Robot Support to use the ‘offset’ parameter to get to the rest of the URLs but I cannot change the sealed management pack. Here’s their advice:
You can use the offset parameter “offset – optional (used for pagination. Defines the record to start paginating. Default is 0)” to move to the next pages.
Please help. Thanks in advance.
Ron
LikeLike
I installed MP from last month and i am still getting status 0 in SCOM. When it happens it happens for all at once.
LikeLike
accidentally imported old MP. All ok
LikeLike
What should i do now when v1 api is deprecated?
LikeLike